Bitcoin Tests Key Support as Oil and AI Fears Squeeze Markets
In brief
- Bitcoin trades at $82,164, just above the a key support line, after touching $83,040 today and giving back part of the gain.
- Oil near $108, 3.7% inflation, and a 10-year yield above 5% keep rate-hike fears alive, while spot Bitcoin ETFs lost about $910 million in two weeks.
- Technical indicators on the charts suggest caution for traders in the near term.
Bitcoin continues to defy seasonal ‘Uptober” expectations, as macroeconomic factors weigh heavily on the digital asset.
Bitcoin is hovering around $82,000 on Monday, up about 1% on the day, after tagging $83,000 early and handing some of it back.
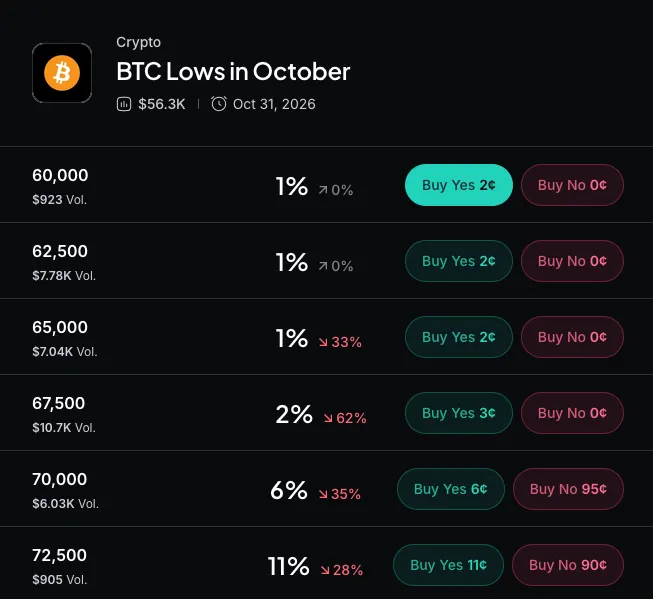
Brent crude, the global oil benchmark, trades near $108 a barrel after weekend attacks on Persian Gulf tankers and Russian crude facilities. Pricey oil raises the cost of fuel and freight, which feeds inflation. The consumer price index (CPI), what households pay, rose 3.7% in September from a year earlier, while the producer price index (PPI), what businesses pay, jumped 6.3%, the biggest annual rise since 2022.
That likely pushes the Federal Reserve toward raising interest rates, which makes borrowing costlier. Markets see roughly a 15% chance of a quarter-point hike next week. You can see it in Treasury yields, the return investors earn lending to the U.S. government: when hike bets rise, bond prices fall and yields climb. The 10-year sits at 5.08% and the 2-year at 4.72%, CNBC data shows.
A near risk-free 5% competes with stocks and crypto for the same money, and it raises the debt costs of the AI giants that borrowed heavily for data centers. Bitcoin trades with that risk basket, so AI selloffs tend to drag it down.
The pain was concentrated in companies paying for the AI buildout with borrowed money. The Nasdaq Composite fell more than 2% on Friday and closed its worst week since June, with AMD down 6% and Micron down 5.6% on the day. CoreWeave, a so-called “neocloud” that rents out AI computing power, lost about 24% over the week, and it funds much of its data center spending with debt and new share sales rather than cash flow.

 →
Hotter inflation and higher yields make that kind of debt costlier to carry, so the stock selloff and the bond market are really the same story.
Bitcoin price: technical analysis
Bitcoin trades at $82,164 on the daily chart, up 0.18% in today’s forming candlestick, sitting right on the 0.236 Fibonacci retracement at $81,603. Fibonacci levels mark where pullbacks tend to pause, and 23.6% is the shallowest, so holding it keeps the climb from the $87,422 high intact. The bounce is weak, though: a week of small candle bodies says neither side is in control.
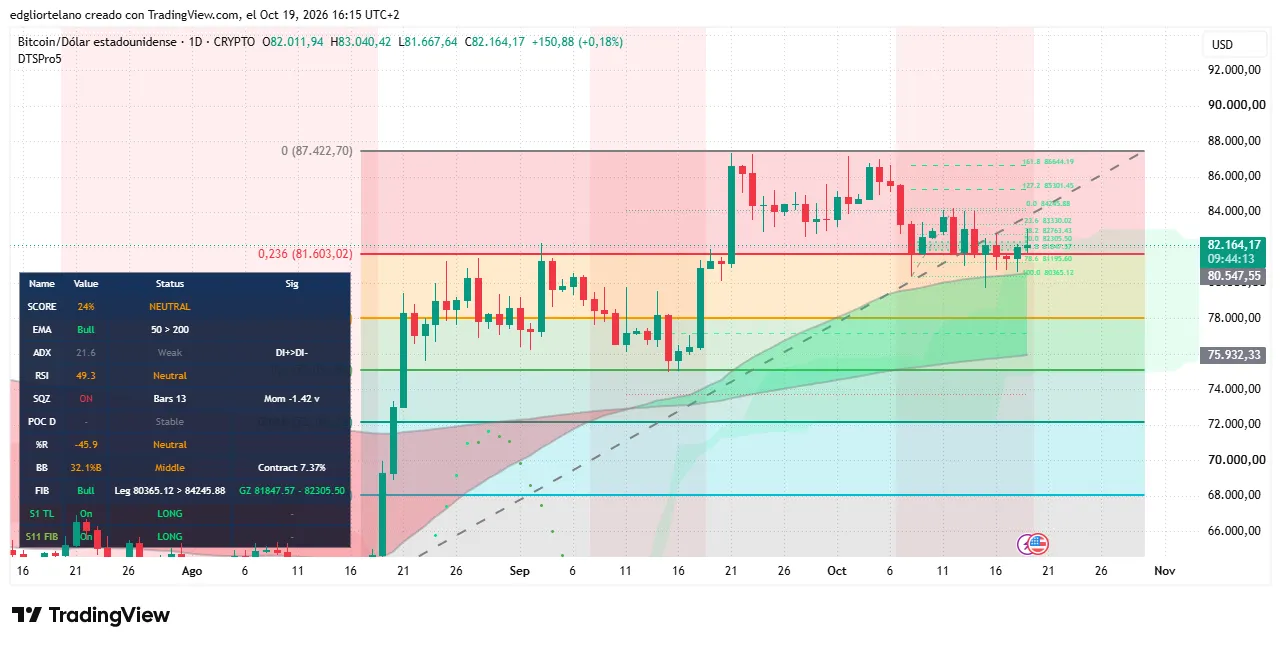
Bitcoin’s current price is also inside the $81,847 to $82,305 "golden zone" of the recent $80,365 to $84,246 swing, where buyers often show up.
The 50-day exponential moving average, or EMA, weights recent prices more heavily and sits at about $80,548, above the 200-day EMA at about $75,932, with current price above both. That formation, known as golden cross, reads bullish because short-term buyers are paying more than long-term holders.
The Average Directional Index, or ADX, measures trend strength, and currently reads 21.6. Below 25 means no firm trend and more false breakouts. The Relative Strength Index, or RSI, is at 49.3, basically dead neutral with neither bulls nor bears dominating the market.
So, without a clear trend, the Squeeze Momentum Indicator has been "on" for 13 days, meaning volatility is compressed like a spring. Momentum at -1.42 leans mildly down.
A daily close below $81,603 opens $81,196 and the 50-day EMA. Bulls need closes above $83,330 and $84,246, ideally with a rising ADX. The Fed meeting next week and major earnings calls (like Meta and Tesla) this week are the next catalysts to follow.
Disclaimer
The views and opinions expressed by the author are for informational purposes only and do not constitute financial, investment, or other advice.
Related stories

Abandoned Bitcoin? Wallet Targeted by Noah Doe Lawsuit Moves $33 Million
Metaplanet to take 93.7% stake in Super League through 2,100 BTC deal
Strive buys $335M in Bitcoin, boosting holdings to 36,818 BTC
